Show Arrays as Sparkline or Badges
New Array Column to display multiply cell values, which can be rendered as Sparklines or with multiple Badges, and supports per-value filtering
One of the many exciting new features introduced in AdapTable 21.2, the latest version of our powerful AG Grid extension, is Array Columns.
Array Columns are normal AdapTable columns, but which contain multiple values in each cell.
They have a number of useful applications, particularly for rendering multiple values.
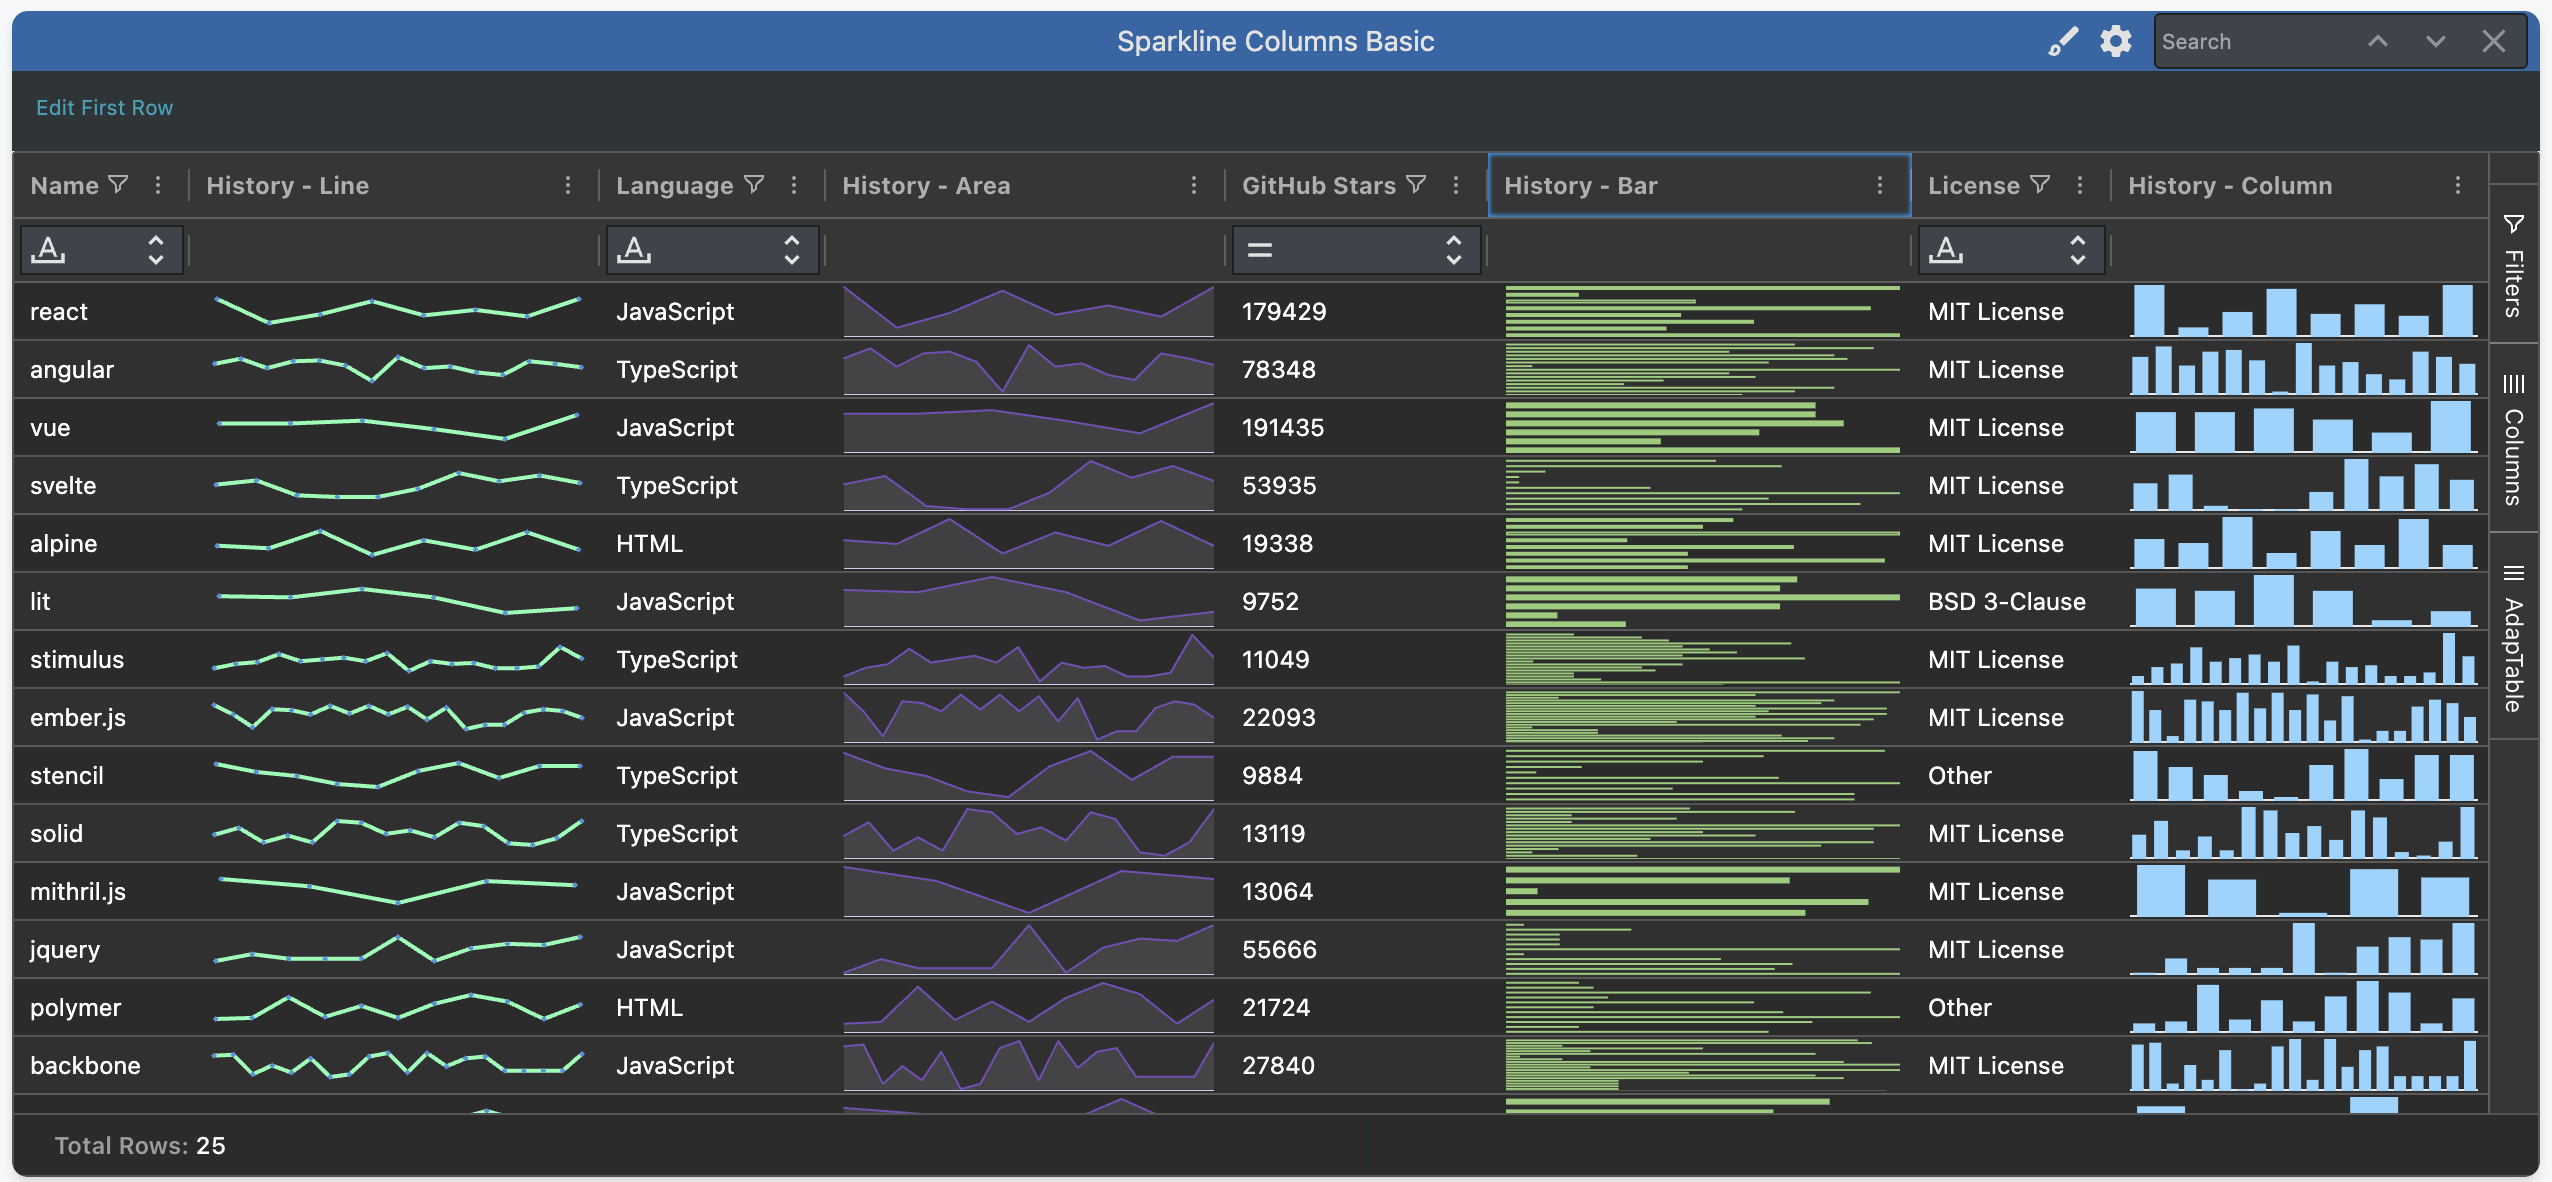
Sparklines
Array Columns are ideal for displaying Sparkline Columns.
AdapTable leverages AG Grid's first-rate charts to offer 4 types of Sparkline Column:
LineAreaBarColumn
Each item in the Array is a different element / point in the graph that AG Grid renders.
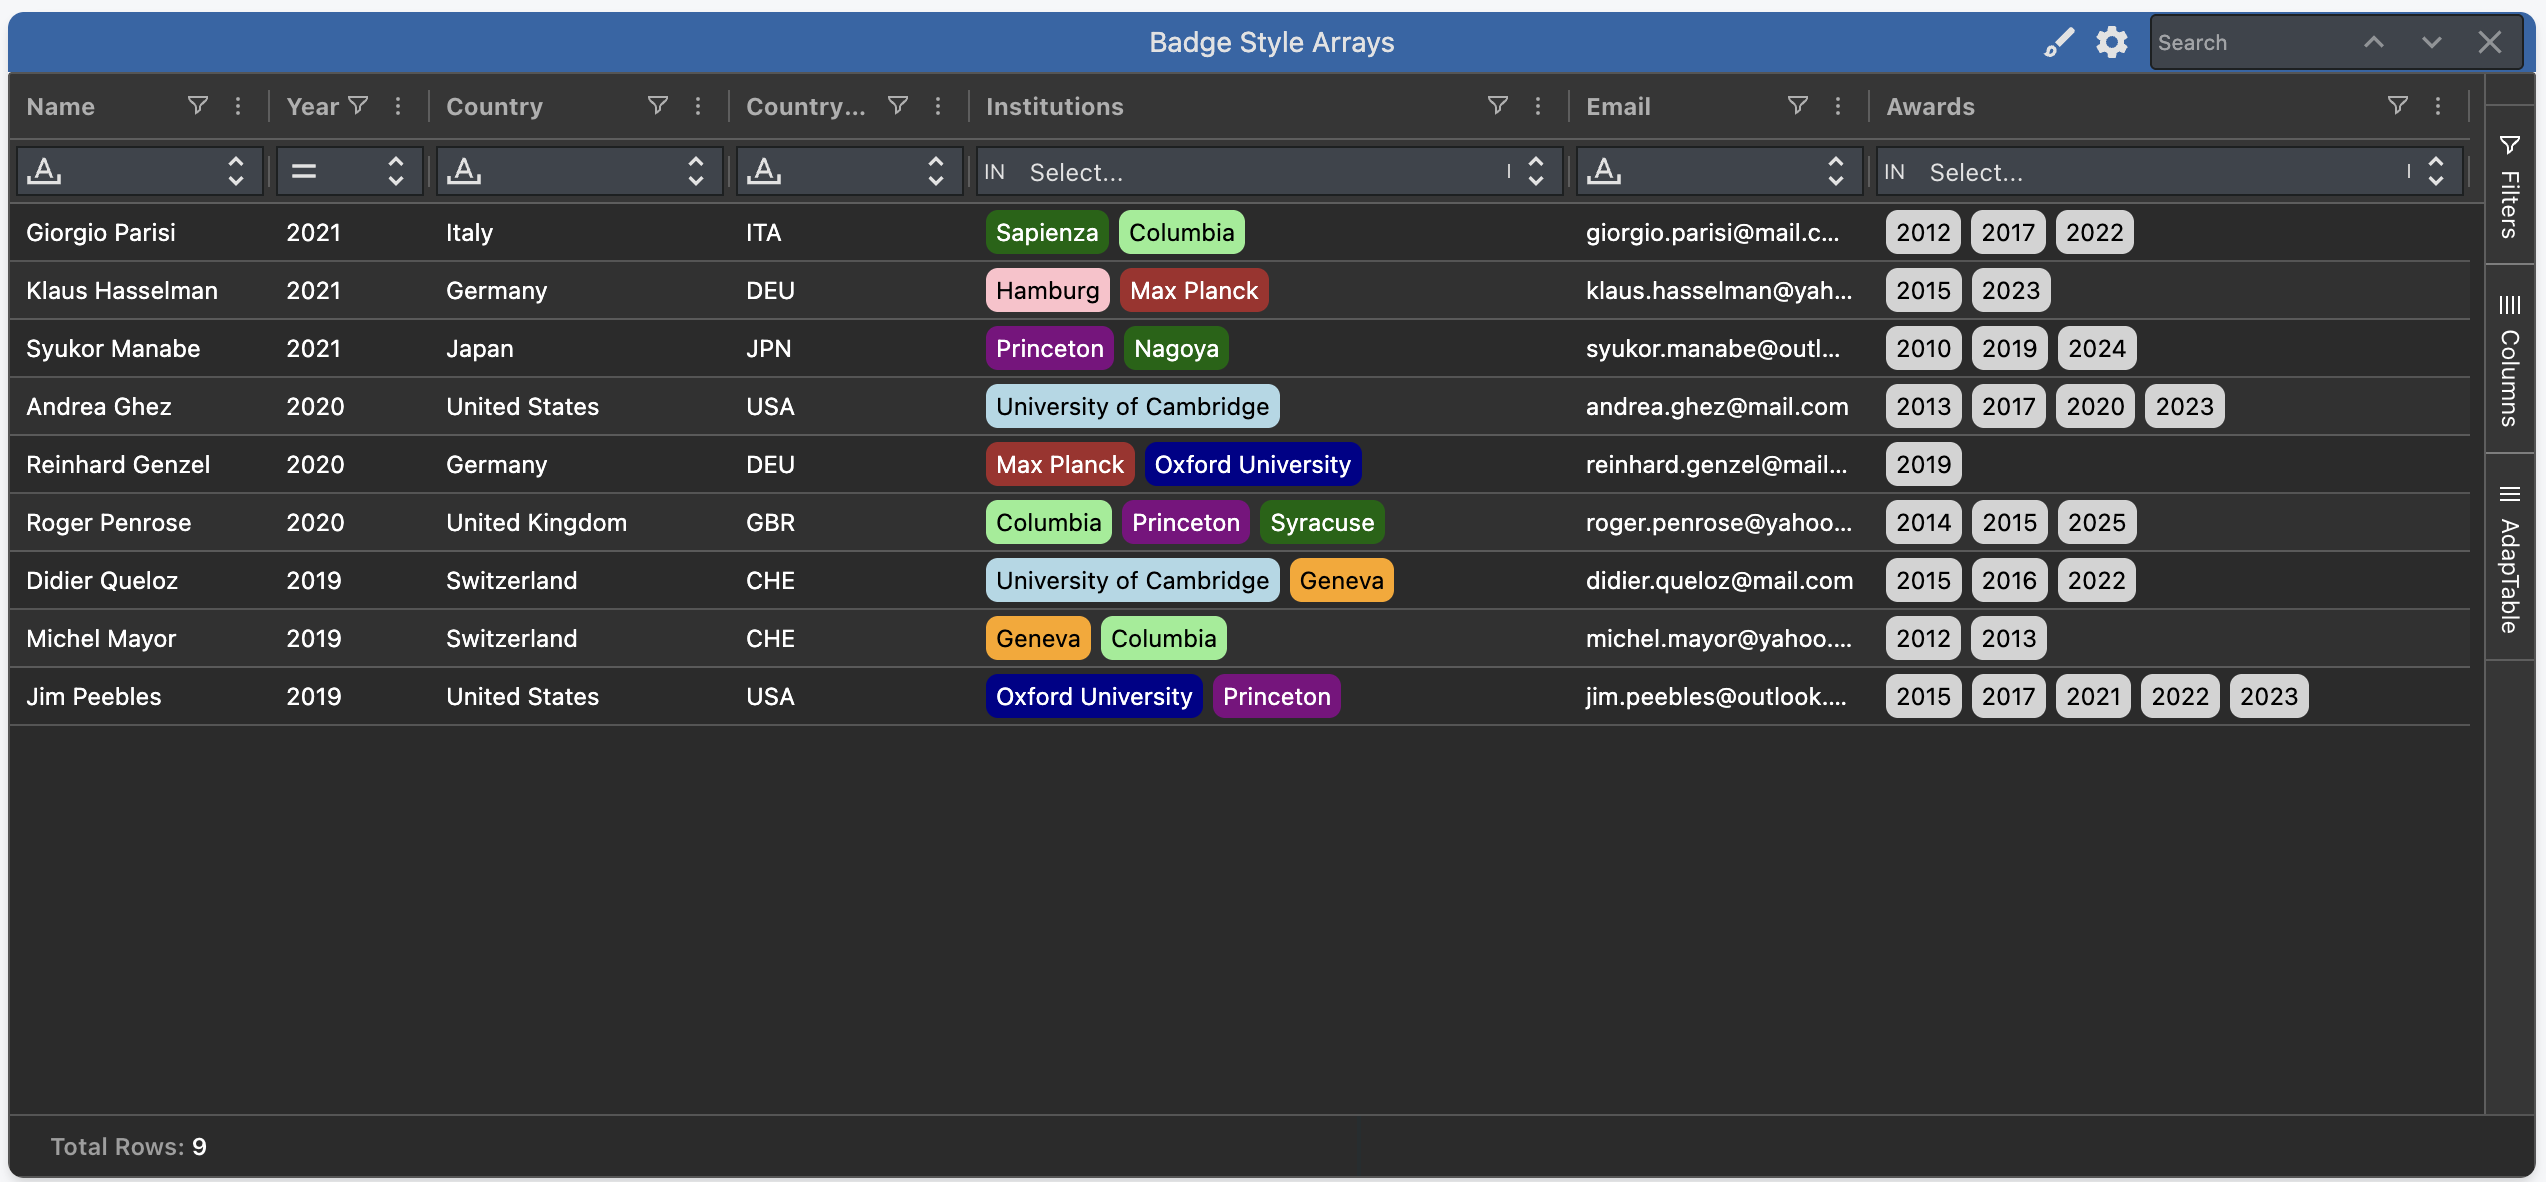
Badges
Another Styled Column which can be used to render Array Columns is the Badge Style.
AdapTable styles each element in the Array as its own Badge.
This enables multiple different Badges to display in each cell.
Hint
- When used with conditions, each Badge can be given its own Style depending on the supplied rule
- This allows creating different styles for each cell value across Rows (see
Institutionsin pic below)
Filtering
Array Columns are fully filterable.
AdapTable uses the In Filter as the default predicate for Array Columns.
Note
Each distinct cell value will appear in the list, allowing users to filter on each one separately
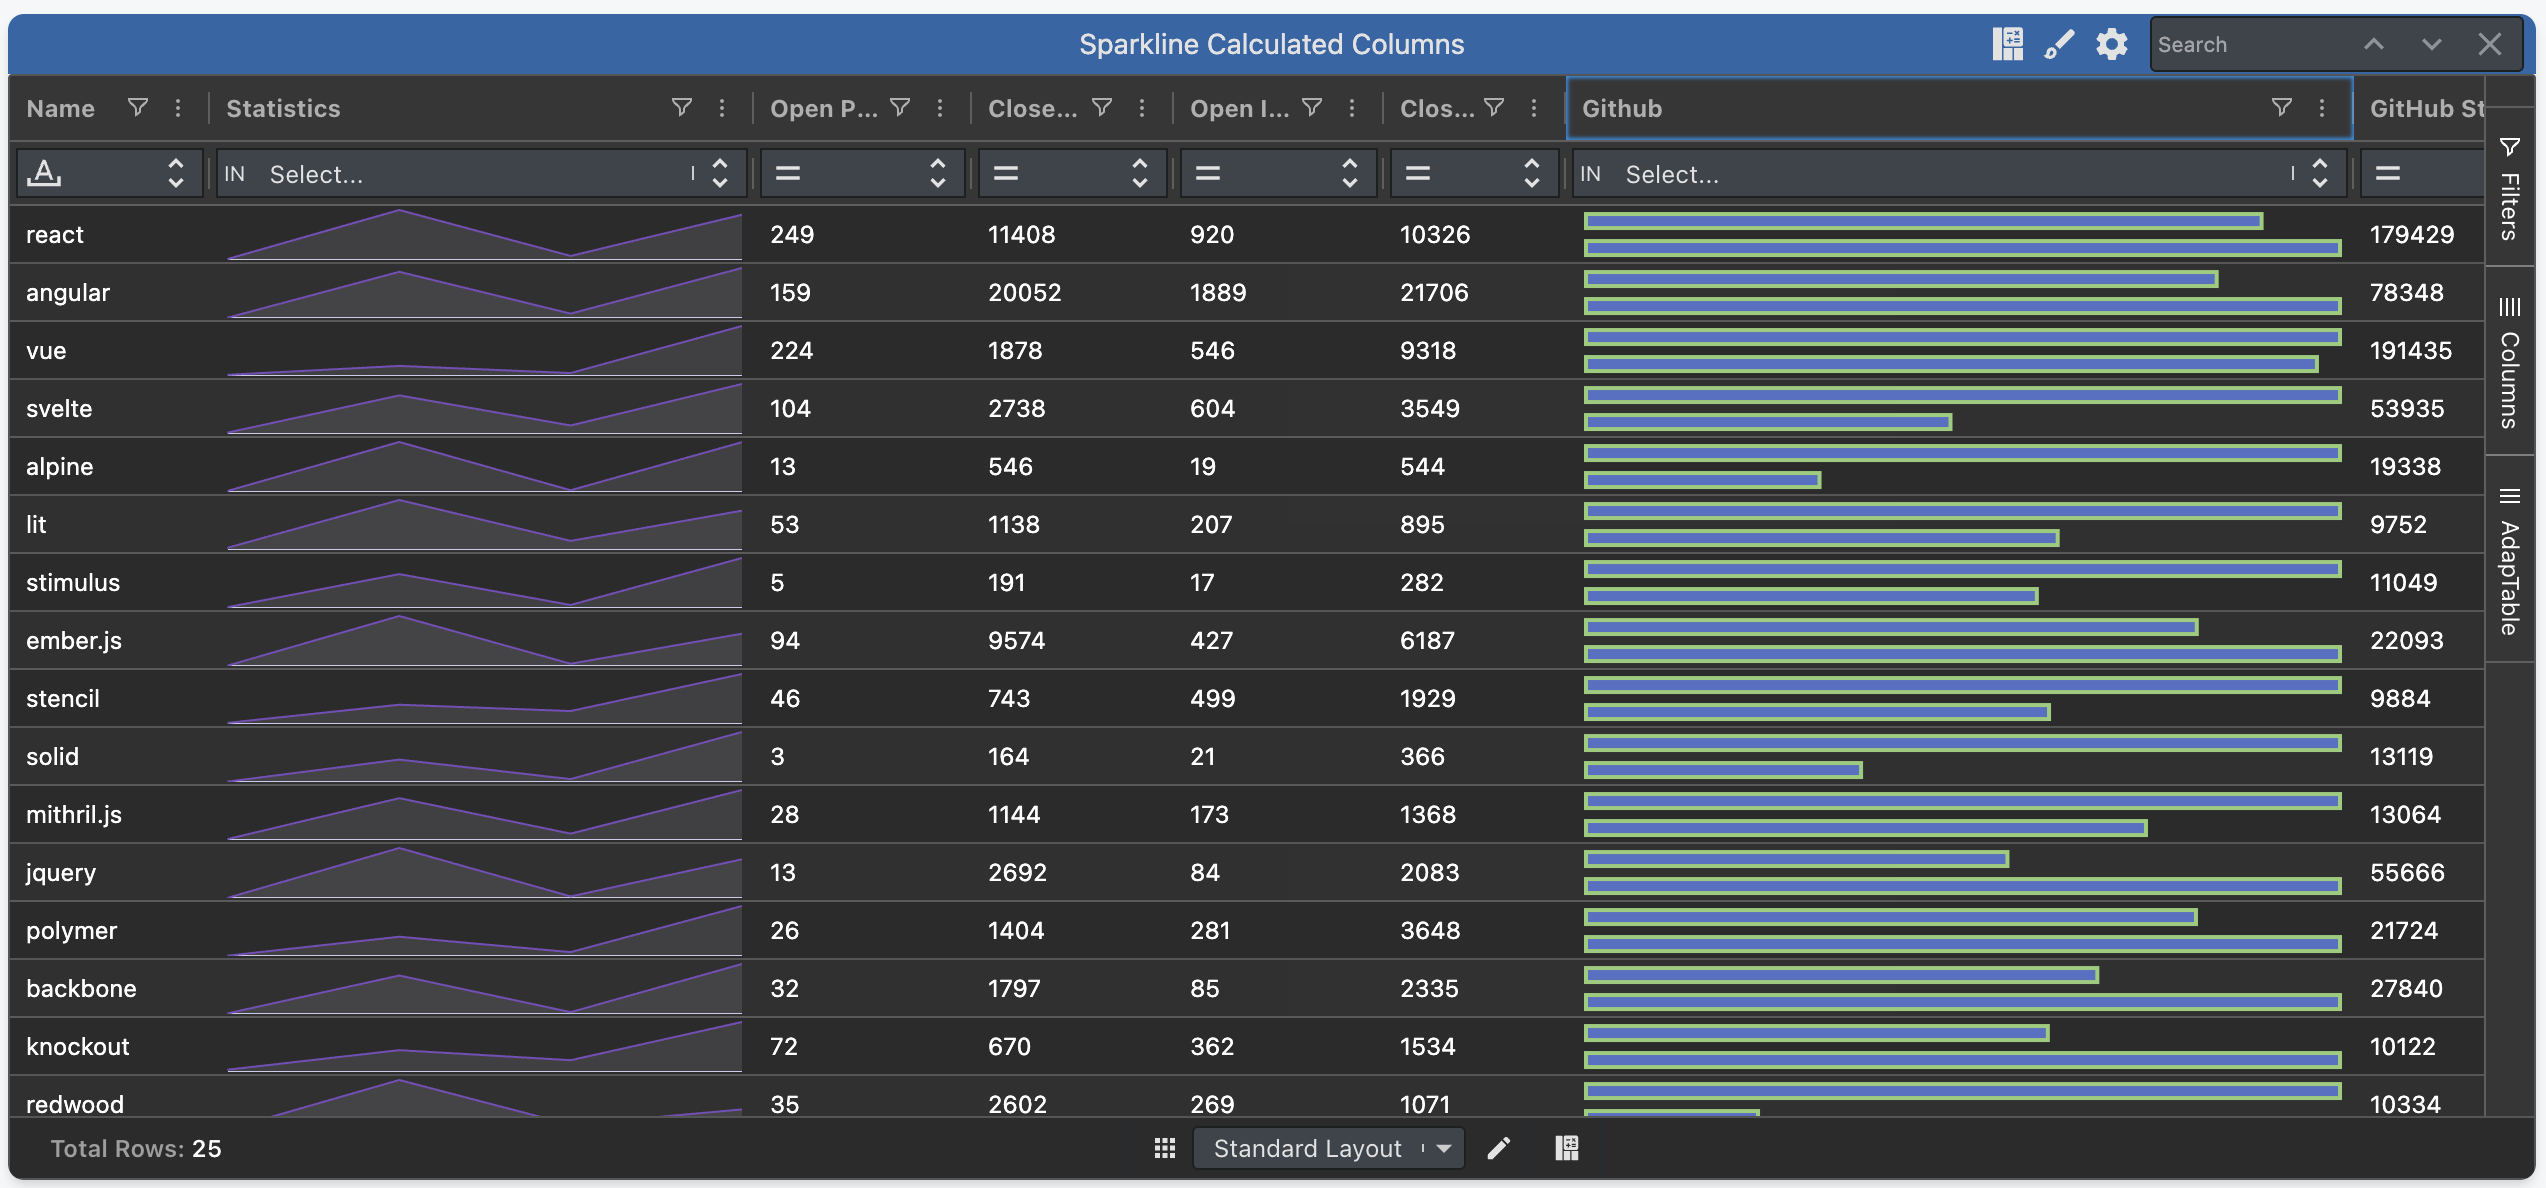
Calculated Columns
One nice, additional, feature is that users can create Calculated Columns which contain arrays.
This is done by using the TO_ARRAY expression function.
When this function is used AdapTable automatically creates the Calculated Column as an array.
Hint
You can render the Calculated Column with Badges or Sparklines, and filter it, as described above
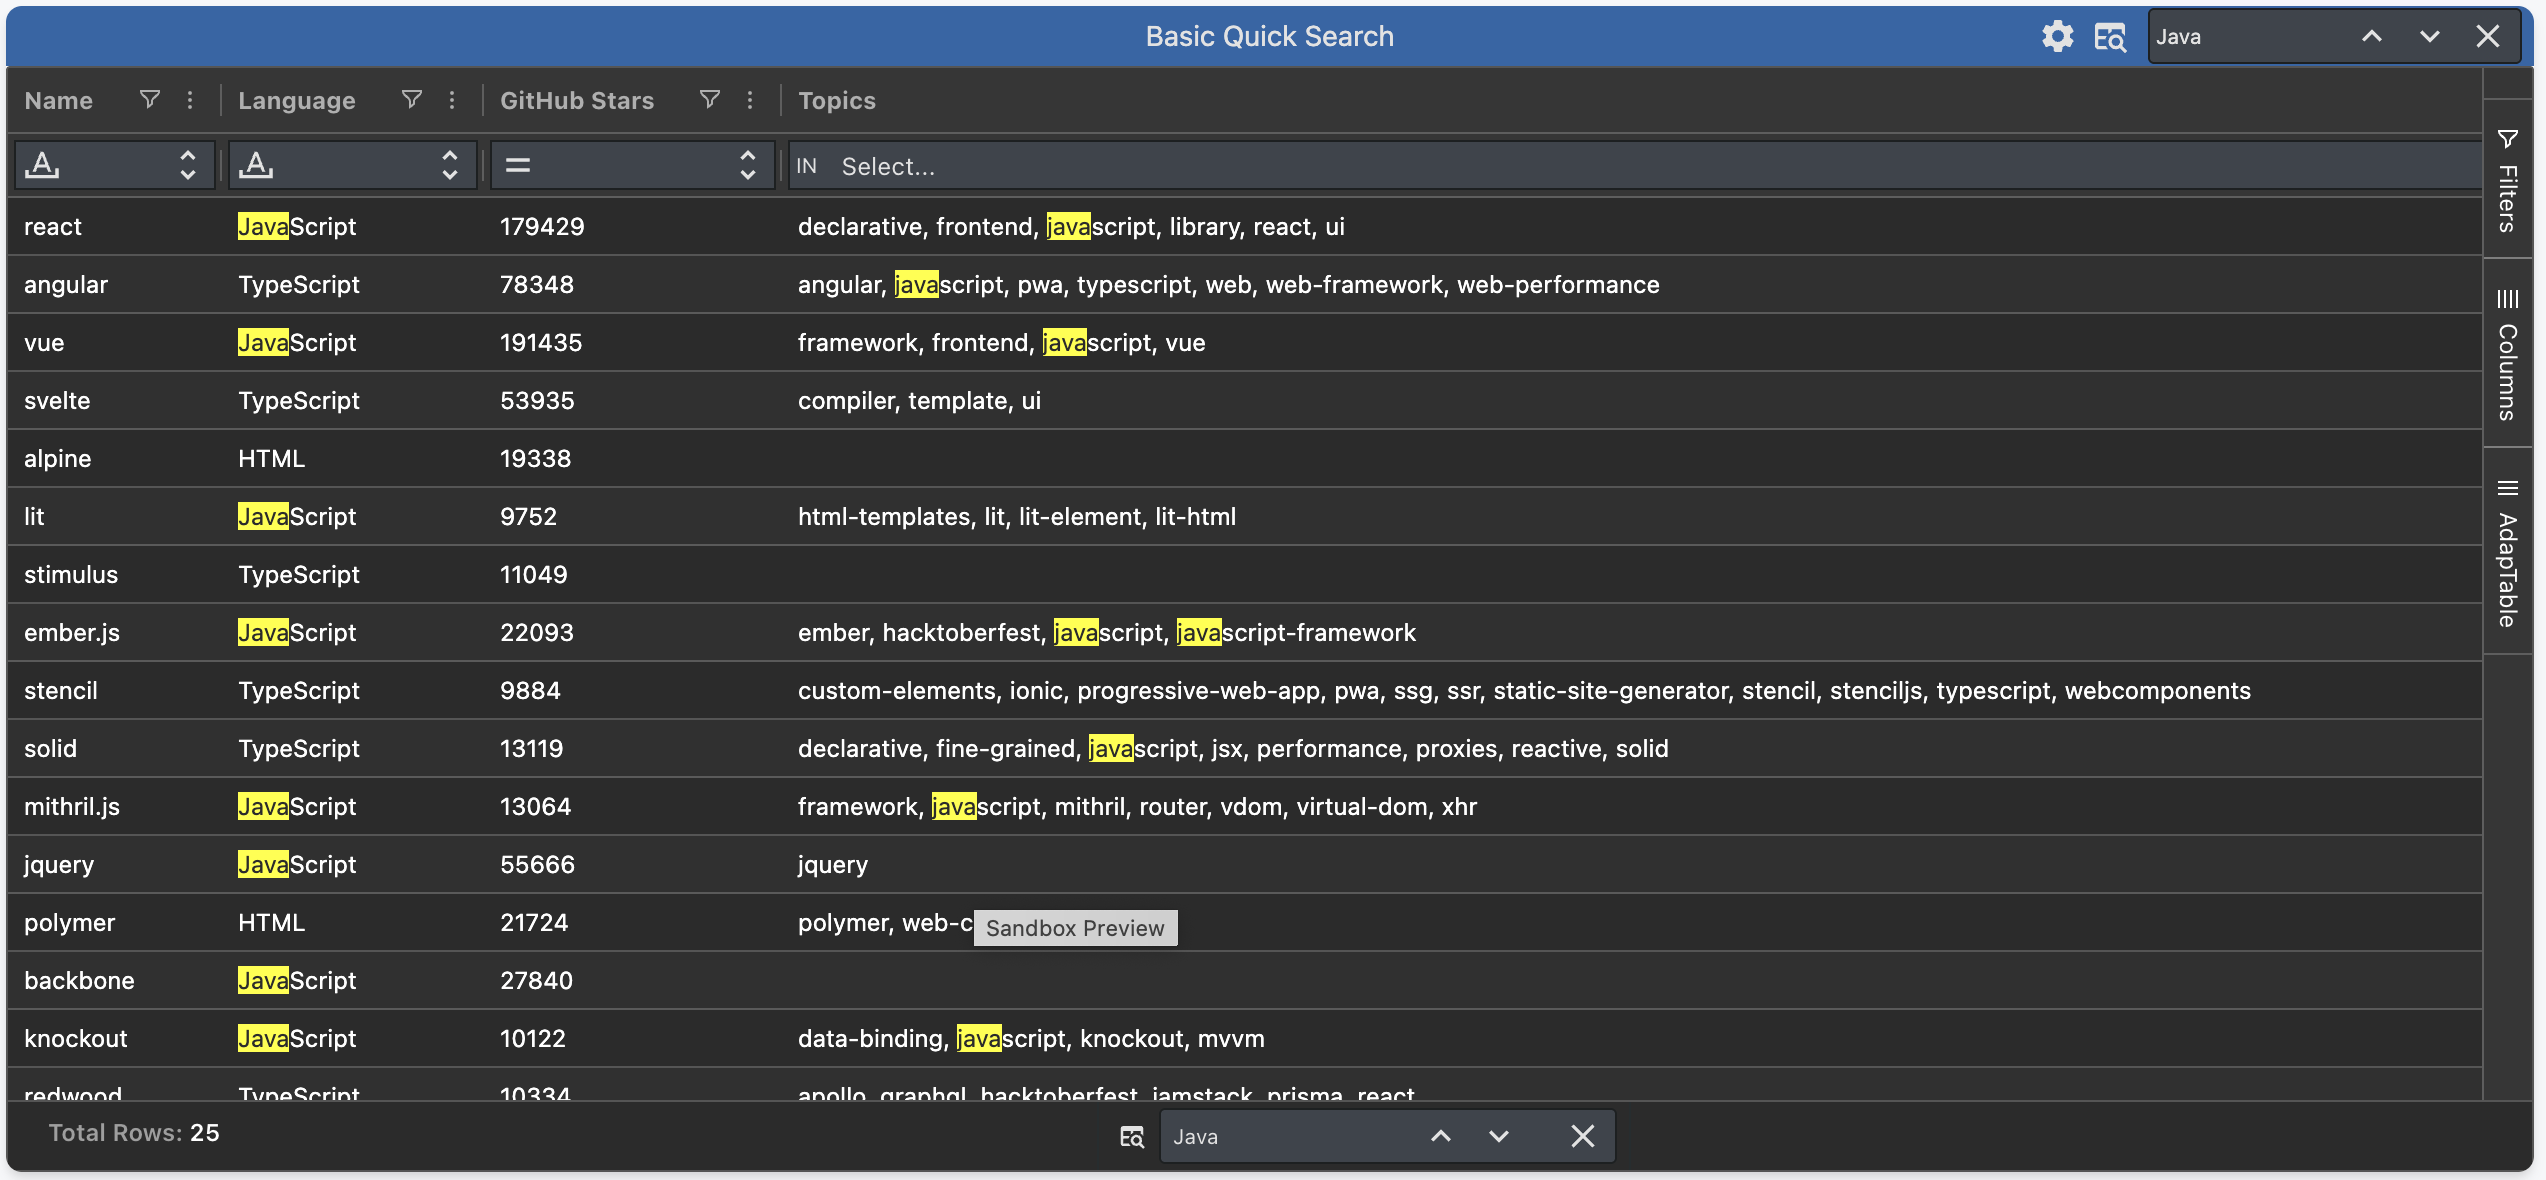
Quick Search
When running a Quick Search, AdapTable will search each item in the Array column individually.