Profiling
Summary
- AdapTable provides 2 very useful resources to help Support Teams profile AdapTable:
- It will provide performance metrics (by leveraging logging)
- It offers performance profiling (by leveraging the Chrome DevTools profiler)
AdapTable provides some very useful resources to help Support Teams profile AdapTable.
Performance Metrics
AdapTable logs performance metrics for certain operations.
Find Out More
Consult the Guide to Logging AdapTable Activity for full details on how AdapTable enables comprehensive logging
These are logged as perf messages.
Note
Make sure to set the Browser's console level to Verbose to see these messages (read instructions for using Chrome)
// log all performance metrics for all AdapTable instances
localStorage.debug = 'Adaptable:*:perf'
// log all performance metrics for a specific AdapTable instance
localStorage.debug = 'Adaptable:<adaptableId>:perf'The perf messages will look like this:
Adaptable:Trades:perf [BEGIN] - initializeAgGrid() +1ms
[...]
Adaptable:Trades:perf [END]   - initializeAgGrid() (waitForAgGrid=TRUE) :: [delta +122ms] +1ms
The delta value ([+122ms]) is the time taken for the operation (initializeAgGrid()) to complete.
The last diff value (+1ms) is displayed for all messages and is the time spent between the previous message and the current one.
Performance Profiling
Another way to profile performance in AdapTable is to use the Chrome DevTools profiler.
AdapTable will show up as a custom track in your recorded profile.
This is a very powerful tool which will give you a better sense of the timing for various operations.
It includes stacktraces and allows you to see the correlation between user actions, other browser events and the AdapTable instance.
Chrome DevTools Profiler
To start a profiling operation, open your DevTools, go to the Performance tab and start recording.
In order to see the custom dev tracks for AdapTable, you have to enable them by setting the adaptableProfileTracks key to "true" in your localStorage:
localStorage.adaptableProfileTracks = 'true'This is the easiest way.
Another option would be to enable the debug channels for performance metrics, as already described above
localStorage.debug = 'Adaptable:*:perf'This will show you all AdapTable instances - each under the AdapTable (<ADAPTABLE_ID) track.
If you have many AdapTable instances, but only want to profile one of them, you can be more specific and enable profiling only for that single instance, enabling the Adaptable:<ADAPTABLE_ID>:perf channel.
For instance you have a 'BigData' AdapTable instance, then you will do:
localStorage.debug = 'Adaptable:BigData:perf'Or you can simply enable all debug channels:
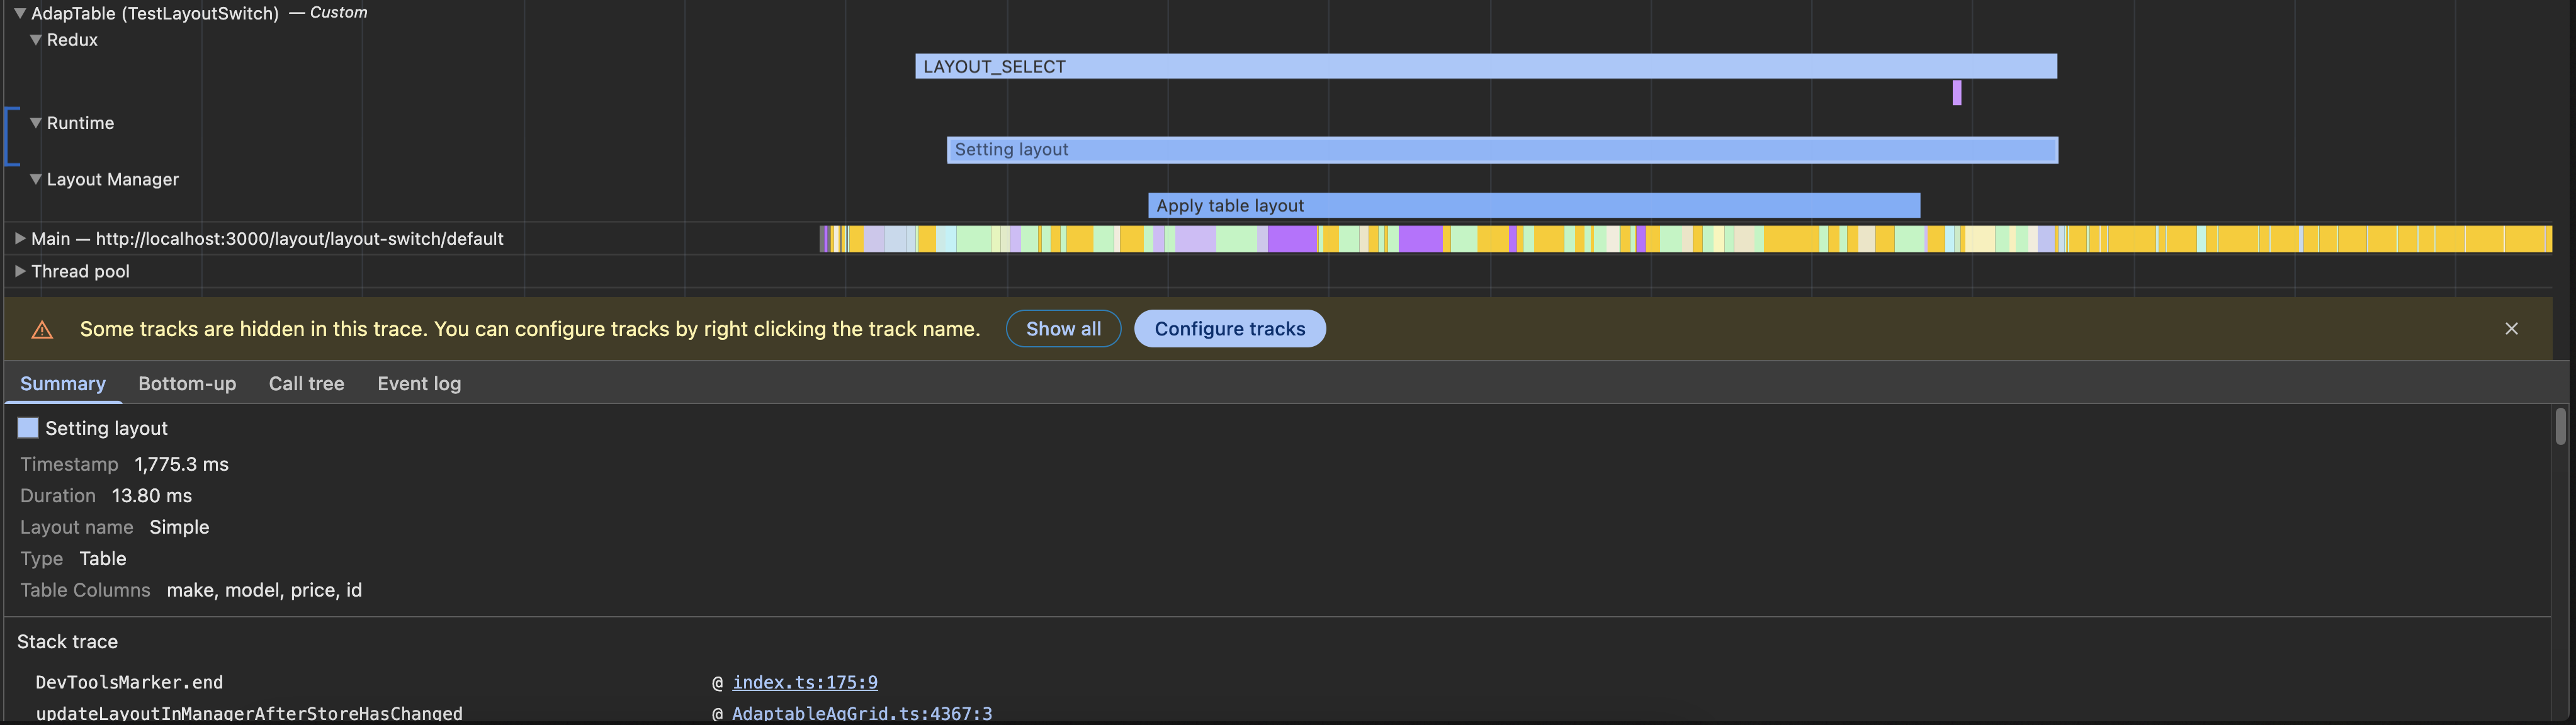
localStorage.debug = '*'In this picture, you can see a recorded profile and how AdapTable displays its custom tracks.
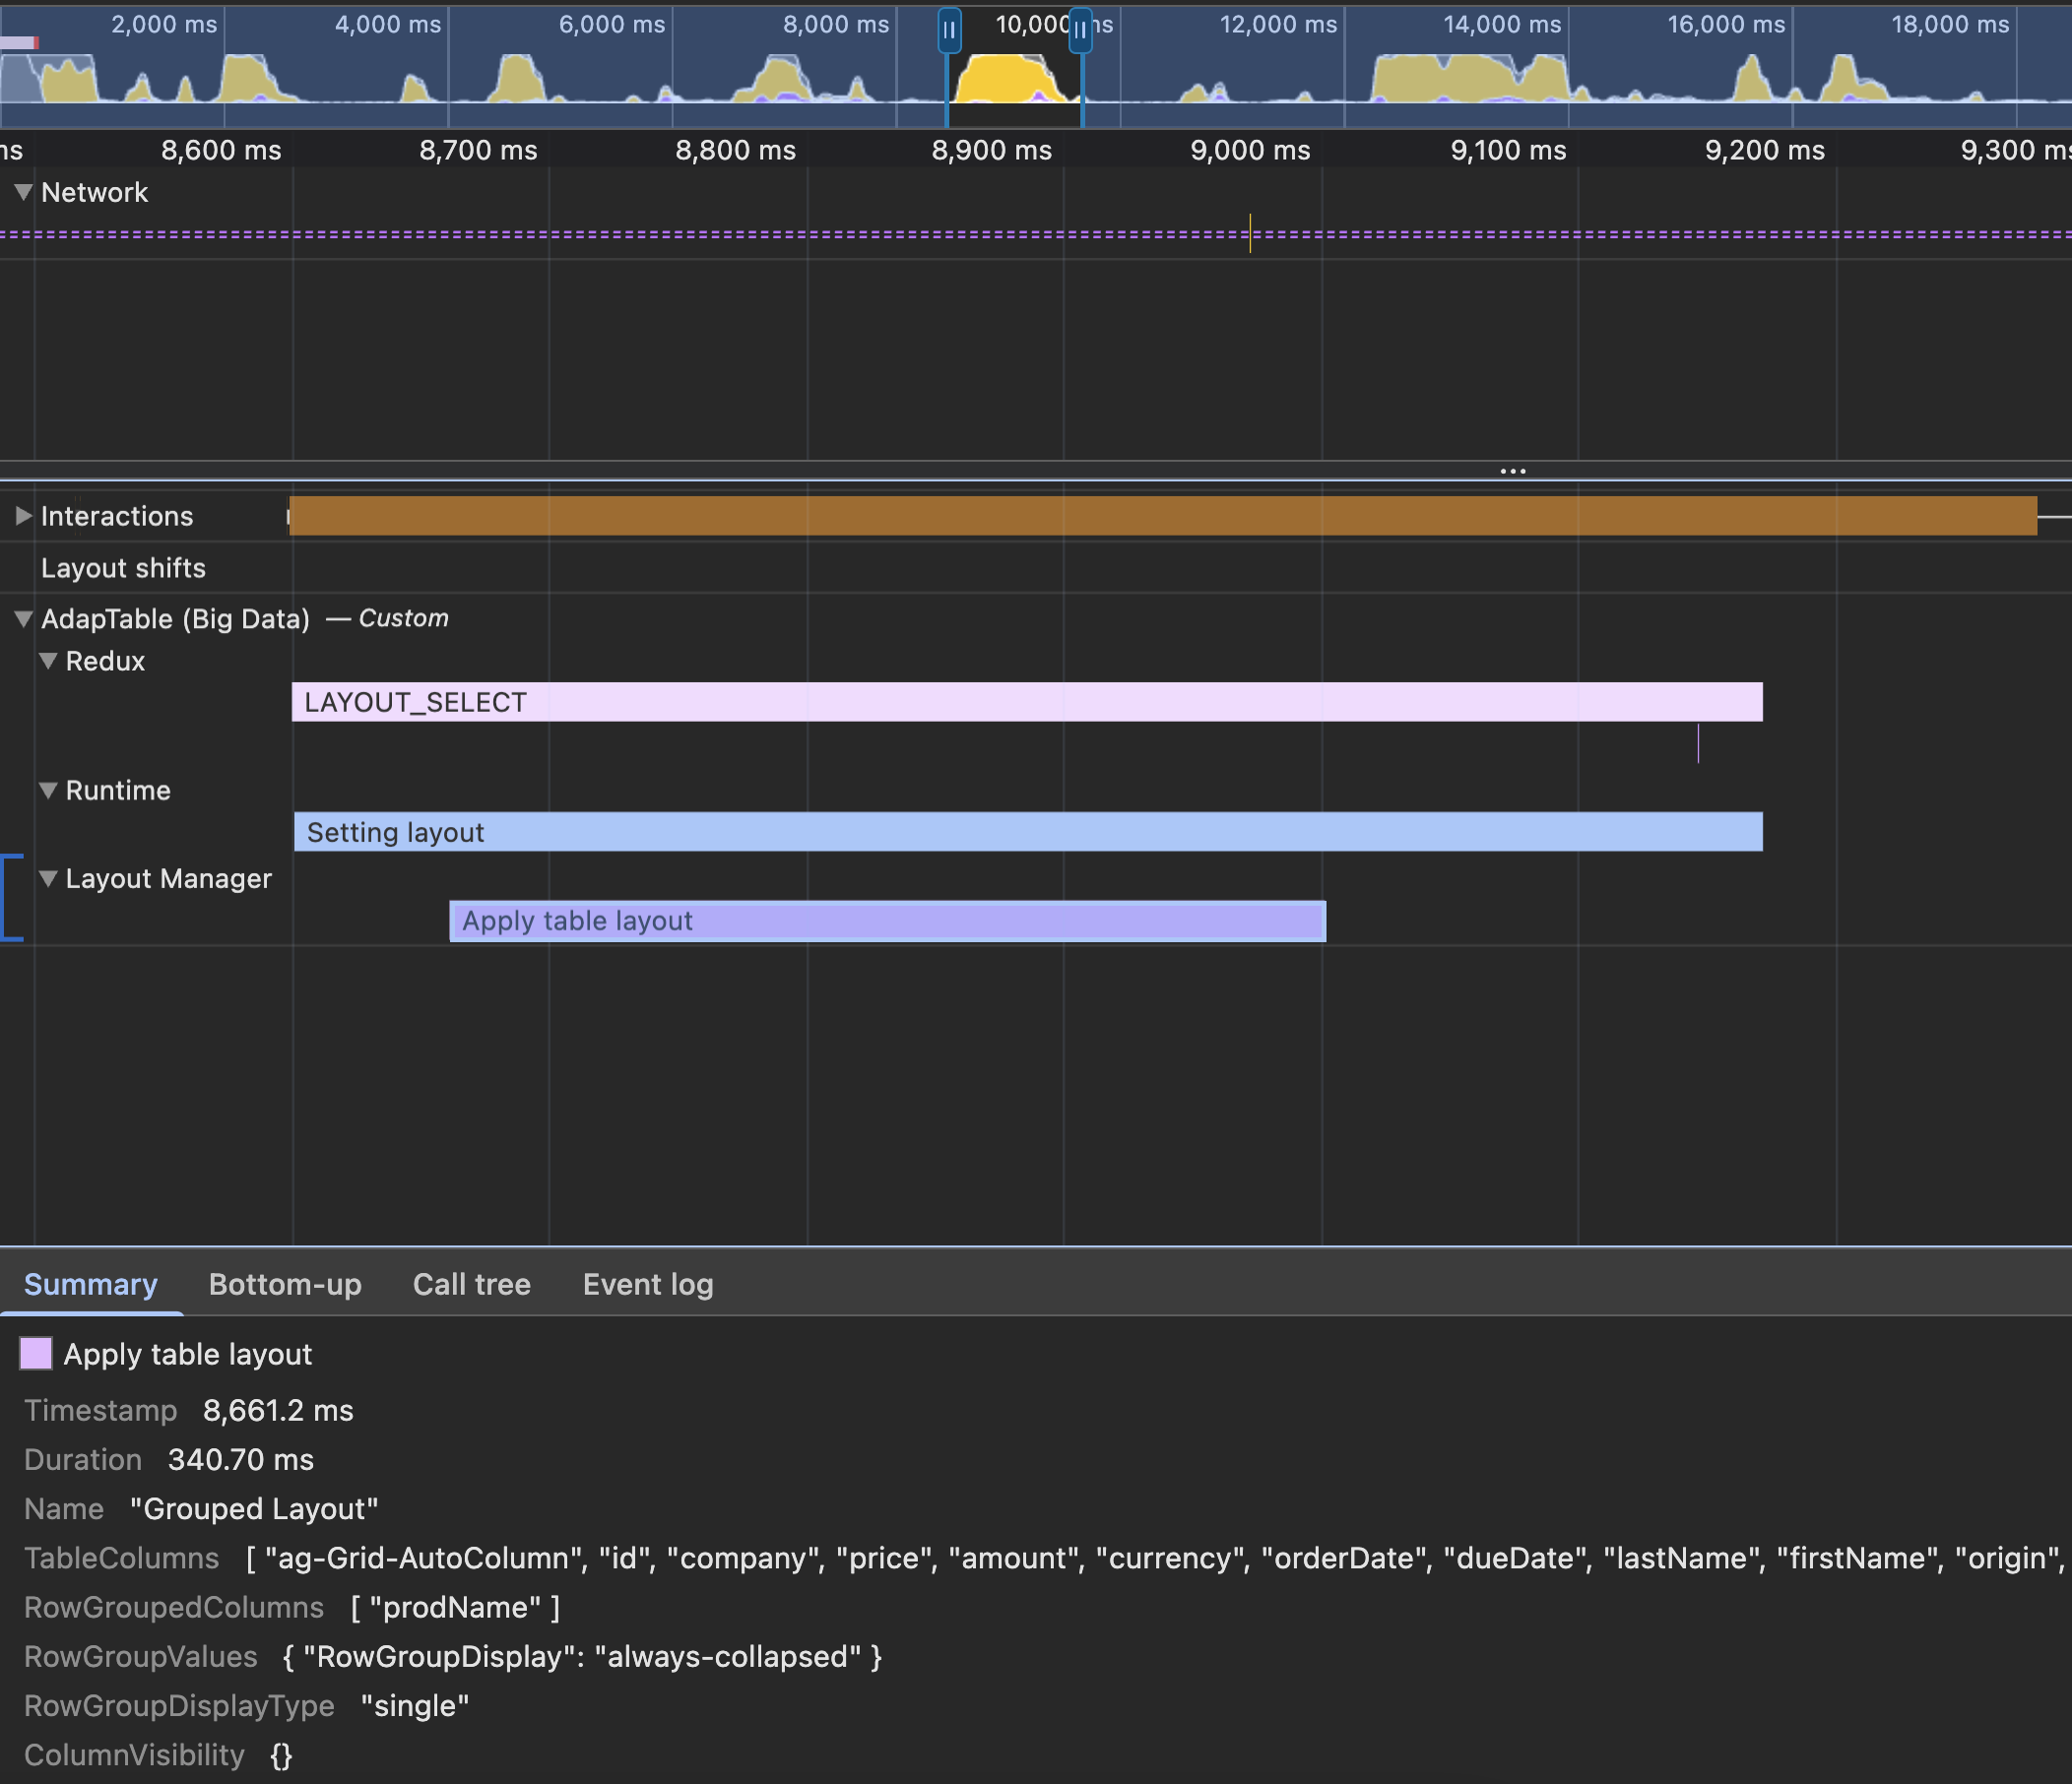
In your recorded profiling traces, you can click various segments to get more info on the specific operation.
In the screenshot above, we selected the 'Apply table layout' operation to get details on it.
Beyond timing (this one took 370ms), we have info on the Layout's Name, Columns, Row Grouping and other useful Layout properties.
Available Tracks and Labels
Each profiled AdapTable instance will show up as a group, under the name Adaptable (<ADAPTABLE_ID).
Inside the group for each AdapTable instance, the following tracks are available:
Init- shows timing and performance for the init phaseRuntime- various actions that can happen at runtime - more to be added as the profiling integration grows.Redux- reflects everyReduxaction that AdapTable dispatches internally and how much each tookLayoutManager- Layout specific updates - interactions with the underlying AG Grid instance.
Each of those tracks can have multiple labels/segments show up.